1、1. 将数据粘贴至origin的表格处。

2、2.选取数据。

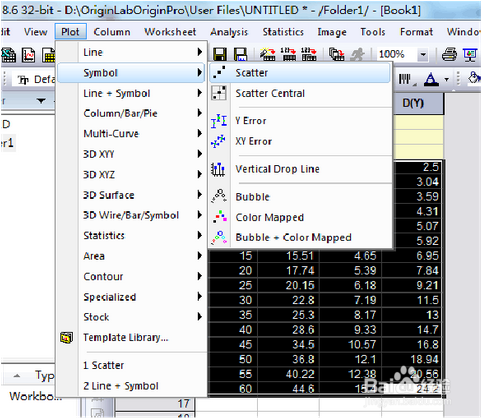
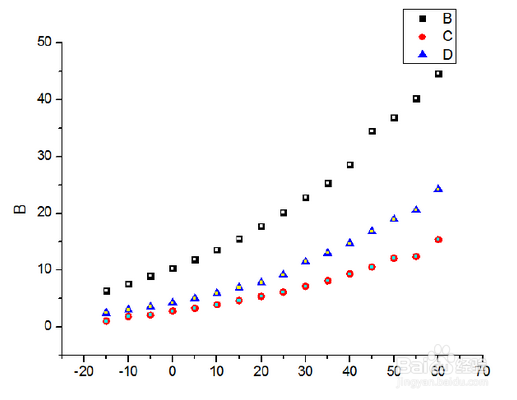
3、3. 选择Plot-Symbol-Scatter即可获得散点图
4、4. 单击散点图中的任意一个数据点
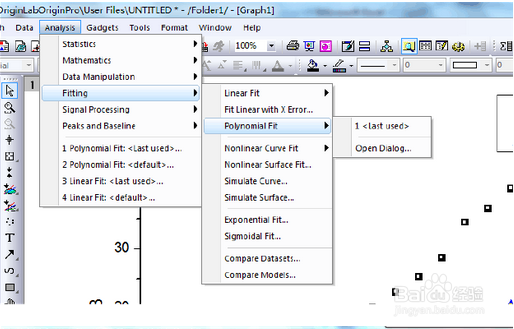
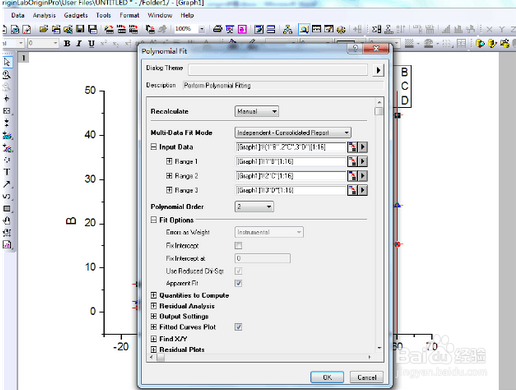
5、5. 选择Analysis-Fitting-Polynomial Fit,在弹出的对话框中点击OK即可获得趋势图
时间:2026-04-22 06:18:20
1、1. 将数据粘贴至origin的表格处。
2、2.选取数据。
3、3. 选择Plot-Symbol-Scatter即可获得散点图
4、4. 单击散点图中的任意一个数据点
5、5. 选择Analysis-Fitting-Polynomial Fit,在弹出的对话框中点击OK即可获得趋势图
